Tuesday, August 16, 2016

Ocean View Realty Group publishes quarterly newsletter for the 2nd Quarter 2016

Ocean View Realty Group publishes quarterly newsletter for the 2nd Quarter 2016


Ocean View Realty Group has published the Ormond By The Sea Florida Quarterly Newsletter, the “Ormond Owner's Report” for the 2nd Quarter 2016.  You will see the numbers of Ormond By The Sea Florida condos sold during the Quarter along with other business and local information.  The newsletter is on an Ocean View Realty Group dedicated web site that is used primarily for the quarterly Ormond Owners Report.  
Here is a link to view the current Ormond Owners Report newsletter and other newsletters.


Ocean View Condominium Rental Group, Inc.,  also doing business as Ocean View Realty Group publishes this informative newsletter each quarter for out of town Ormond By The Sea property owners. Ocean View Realty provides non-resident owners a source of information about the local area that they may not otherwise receive.   
Business and local information is published in each newsletter as well as real estate market information to keep out of town owners and others interested in Ormond By The Sea Florida and the surrounding areas up to date with what is happening.  


You can sign up to receive an email from the web site whenever an updated Ormond Owners Report newsletter is published.  Simply follow the above link and add your email address in the subscribe box at the upper left of the home page.  As news is added, usually once every 3 months, you will get an email with the recent newsletter information so you will not need to actually go to the web site unless you would like to add a comment or check out the links to other Ocean View Realty Group web sites and blogs.  

Contact Realtor® Rhonda Lehnen of Ocean View Realty Group at 386-441-8245 today for additional information and to get a free market analysis for your Ormond By The Sea condo or home or visit the Ocean View Realty Group web site for lots more information about Ormond By The Sea Florida homes and condos for sale and for rent as well as the real estate market in Ormond Beach.

Thursday, August 04, 2016

Ocean View Realty Group publishes quarterly newsletter for the 2nd Quarter 2016

Ocean View Realty Group publishes quarterly newsletter for the 2nd Quarter 2016

Ocean View Realty Group has published the Ormond By The Sea Florida Quarterly Newsletter, the “Ormond Owner's Report” for the 2nd Quarter 2016.  You will see the numbers of Ormond By The Sea Florida condos sold in th first half of the year along with other business and local information.  The newsletter is on an Ocean View Realty Group dedicated web site that is used primarily for the quarterly Ormond Owners Report.  
Here is a link to view the current Ormond Owners Report newsletter and other newsletters.

Statistics for Ormond by The sea homes and condos for sale and sold can be viewed on the Ocean View realty Group web site market watch page.

Tuesday, August 02, 2016

Open House Sunday August 7, 2016 Seabridge North, Ormond By The Sea, FL

Seabridge North  unit 111
3180 Ocean Shore Blvd.
Ormond Beach, FL 32176

Asking $174,500

                                                           OPEN HOUSE
                            Sunday August 7
                                  1:00 - 4:00

                            Come check it out!


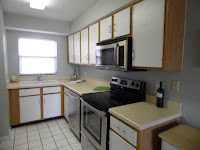
Two bedroom 2 bath condo across the street form the beautiful Atlantic Ocean with a view.   Freshly painted inside with new carpet.  Stainless appliances.   Master bath has a walk in shower.  Tropical touches throughout and being sold furnished.  Stack washer/dryer.   Small pets under 35 pounds. One assigned parking spot with covered parking. 


Saturday, July 30, 2016

Ormond By The Sea Florida mid-year Home sales analysis 2016

Ormond By The Sea Florida mid-year Home sales analysis
This table shows the homes sold in Ormond By The Sea Florida for the first 6 months
of the year through the Daytona Beach Area Realtors® Multiple Listing Service (MLS)
 Sales prices are up a little and the price per square foot is also up.

Year
Sales
Low $
High $
Average ask
Average sold
Avg
SQ. FT
sq. Ft avg $
Avg DOM
2016
139
70,000
675,000
230,027
219,904
1469
153
102
2015
138
74,000
690,000
198,859
188,615
1428
131
154
2014
127
56,000
610,000
191,986
181,474
1493
122
101
2013
106
44,700
1,599,000
188,079
171,604
1386
124
123
2012
98
37,000
395,000
170,357
159,588
1489
107
78
2011
94
50,000
895,500
159,091
146,152
1463
100
104
2010
85
60,000
565,000
157,035
143,881
1380
104
115
2009
61
64,900
475,000
145,467
132,881
1217
109
94
2008
71
74,000
500,000
192,072
175,221
1279
123
84
2007
53
120,000
1,185,000
257,157
239,760
1256
191
103
2006
71
15,5000
1,200,000
337,277
321,657
1390
231
86
2005
161
150,000
1,050,000
291,034
279,467
1455
192
59
2004
126
100,000
930,000
220,071
212,248
1402
151
48
2003
123
79,000
690,000
181,551
171,966
1414
122
64
2002
134
54,000
625,000
142,313
135,149
1375
98
52
2001
121
53,000
585,000
118,595
113,249
1470
77
52


Blog Archive